

What This Page Shows
This page reports how closely RevFEP reproduces experimentally measured binding free energies on two public protein–ligand benchmark sets: the JACS set (Wang et al., 2015) and the Merck set (Schindler et al., 2020), using the curated structures from Ross et al. (2023). Every number comes from a production RevFEP run with the default settings described in How the Benchmarks Were Run, so it reflects what you get when you submit a series with the defaults. For reference, each target also shows Schrödinger’s published FEP+ results for the same ligands.Summary
Averages of the per-target statistics below. Each target counts once, whatever its size.
RMSE and MAE are in kcal/mol. JNK1 and the redocked c-Met (+1) series are left out of the averages; see the notes under the per-target table.
Results by Target
* JNK1: the RevFEP run treats the two flipped binding poses of 17 molecules as separate ligands (38 entries for 21 molecules). FEP+ combines each pair into one value per molecule, so this row is not a like-for-like comparison and is left out of the averages.
† c-Met (+1, redocked): the same six ligands as c-Met (+1), started from redocked poses instead of the poses supplied with the benchmark. It is shown to illustrate how much the starting pose matters, and is left out of the averages.
‡ A few ligands have no FEP+ prediction in the public data: CDK8 (1 ligand), SHP2 (1), SYK neutral (3) and SYK −1 (1). For these targets both columns are computed on the ligands that have both predictions, so the RevFEP statistics can differ slightly from the figure below, which shows every ligand.
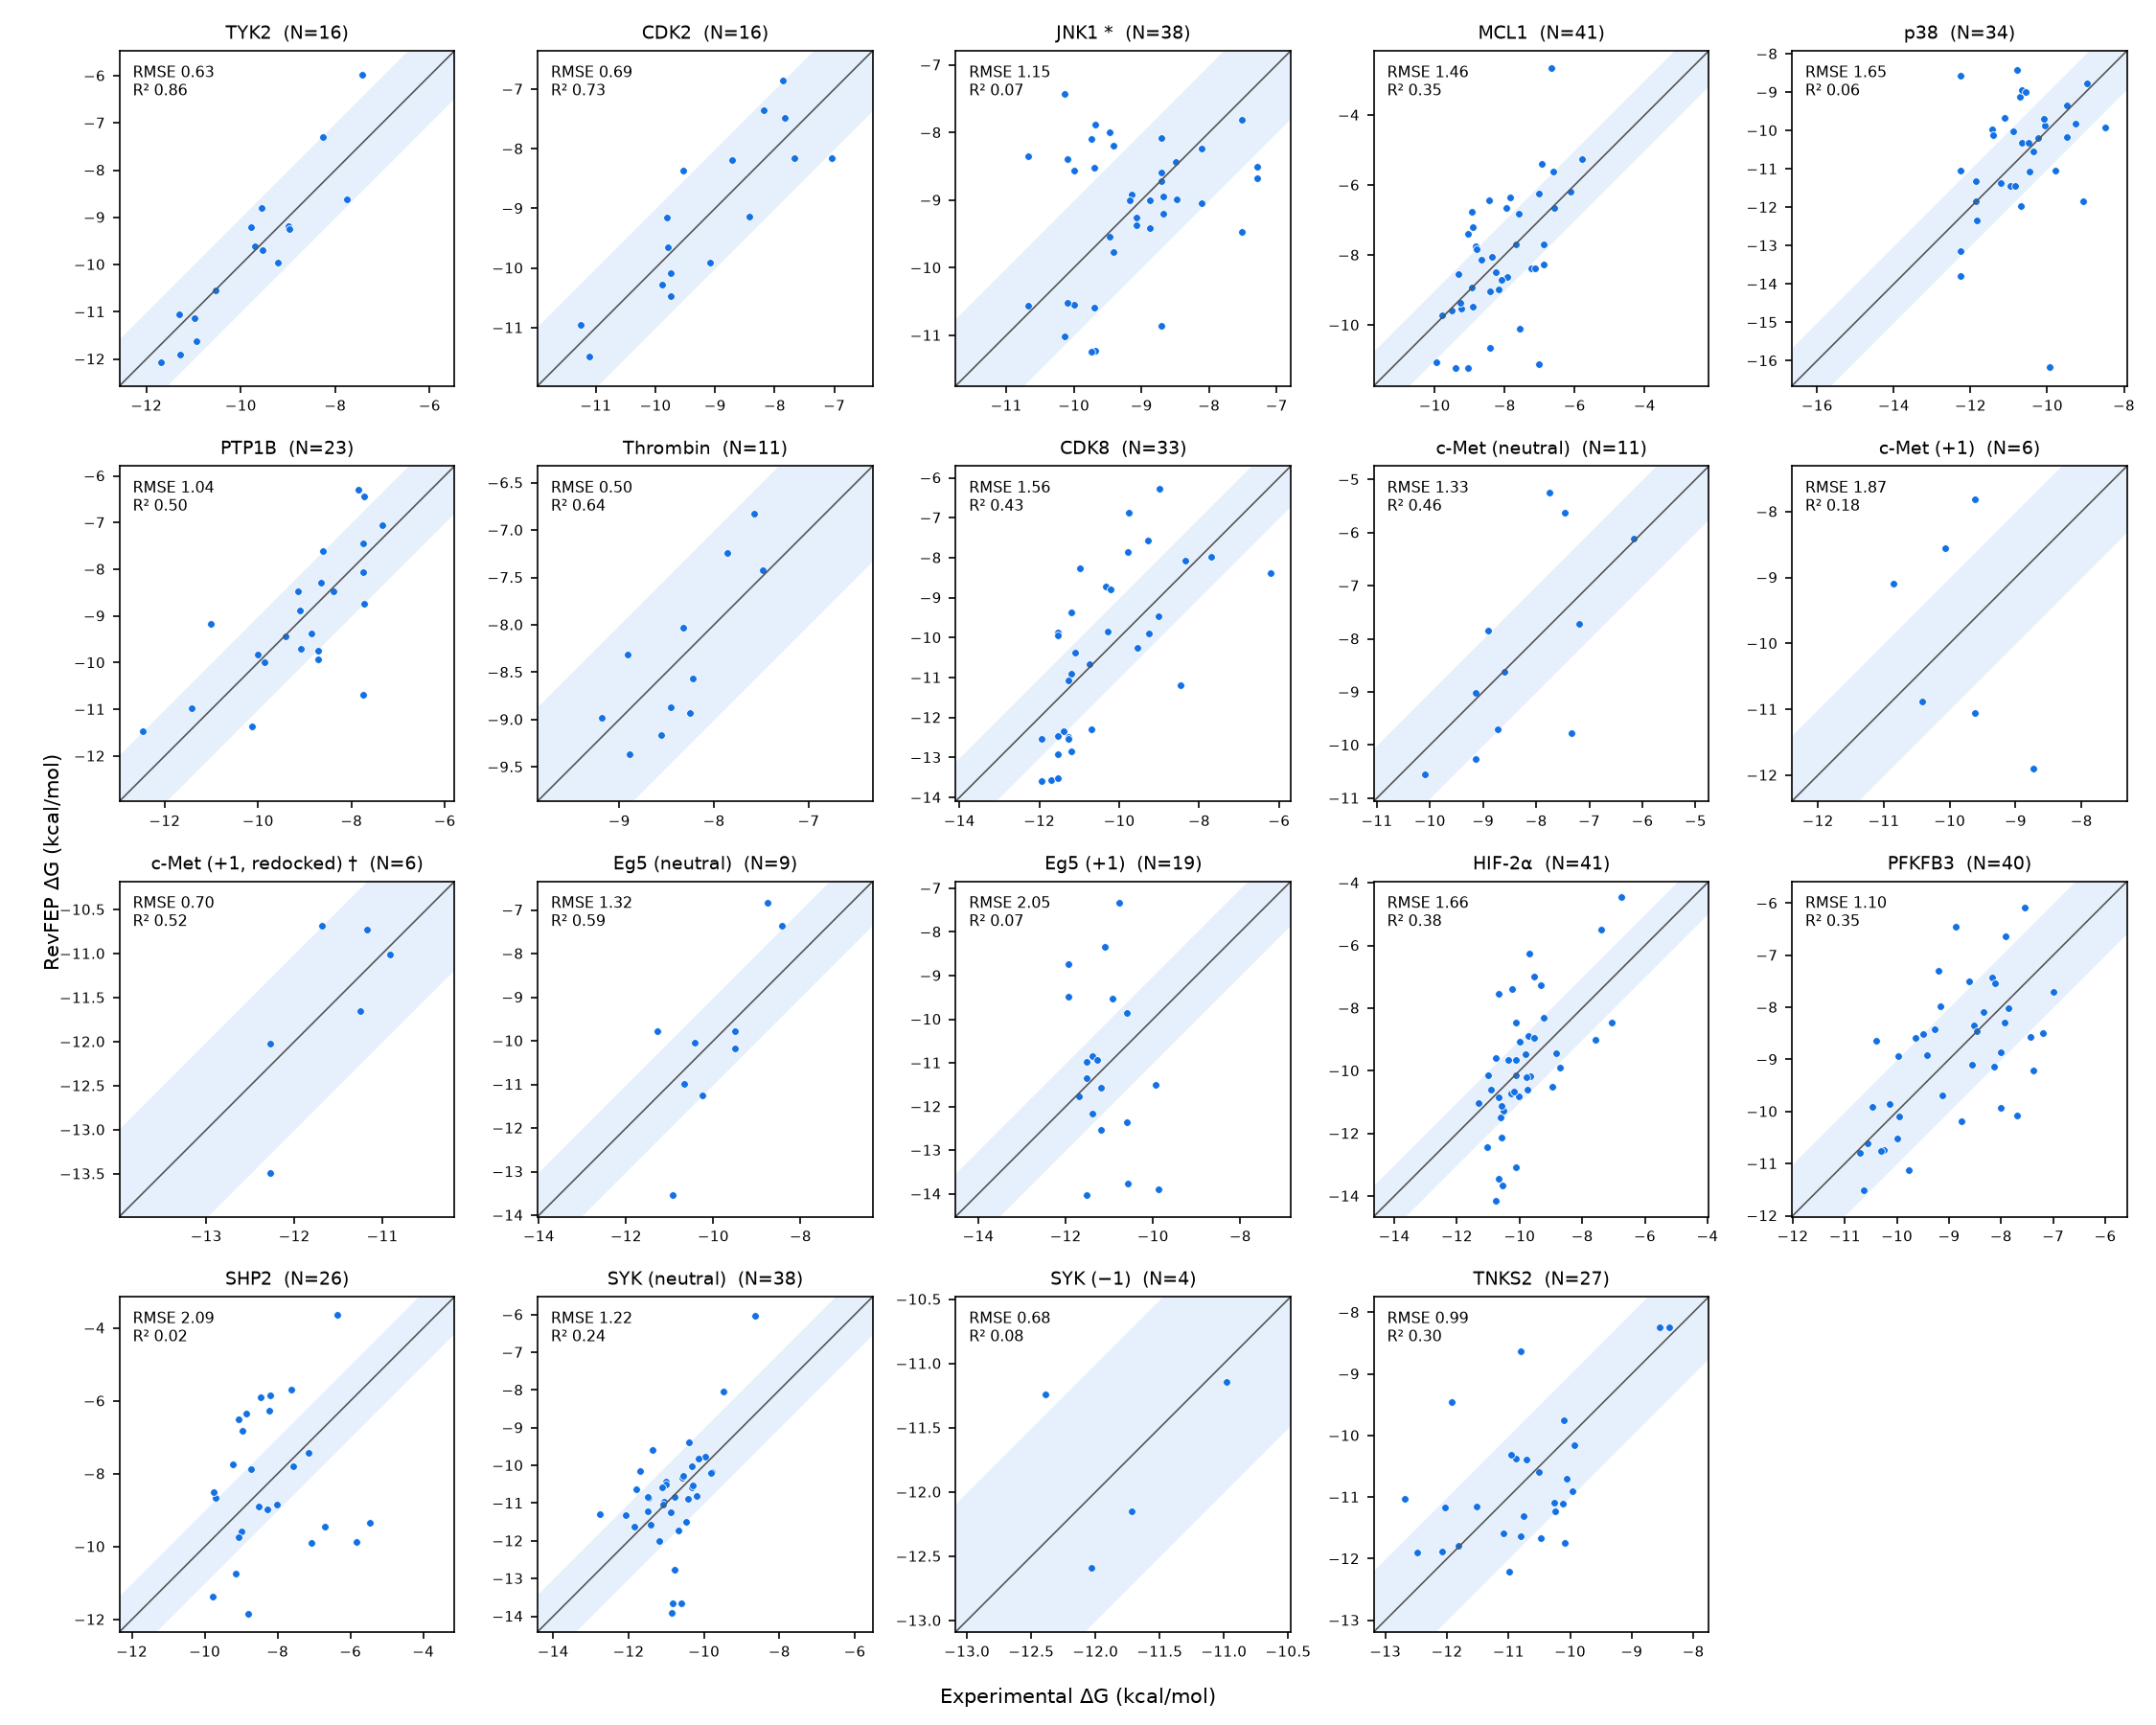
Predicted against experimental binding free energy for every RevFEP benchmark target. The diagonal is perfect agreement; the shaded band is ±1 kcal/mol.
How the Benchmarks Were Run
Every target was run through the standard RevFEP pipeline with its default settings (Protocol A). Nothing was tuned per target.
Structures, ligand poses and protonation states are the ones published with the benchmark. RevFEP does not change the net charge of a ligand along an edge, so series that mix charge states (c-Met, Eg5, SYK) were run as separate same-charge subsets. The published FEP+ results include charge-changing edges and run each of these series as one network.
How the Numbers Are Calculated
- ΔG per ligand. RevFEP’s relative free energies (ΔΔG) are combined into one ΔG per ligand. Because relative calculations fix ΔG only up to a constant, the predictions for each target are shifted so that their mean equals the mean experimental value. The FEP+ values are shifted the same way, over the same ligands.
- RMSE and MAE are the root-mean-square and mean absolute errors of ΔG, in kcal/mol.
- R² is the square of the Pearson correlation coefficient; ρ is Spearman’s rank correlation.
- FEP+ reference. Ligand-level FEP+ (release 21-4) predictions are taken from Schrödinger’s public benchmark repository, matched to RevFEP ligands by name. The experimental values in both data sets agree to within 0.01 kcal/mol for every matched ligand.
Reading These Results
- These are single runs. Each edge was simulated once, and a minimal spanning tree has no closed cycles, so these results come without a statistical uncertainty or a cycle-closure check. Repeat runs and networks with cycles would add an error bar and a consistency check.
- Small sets are noisy. R² and ρ computed on fewer than about 15 ligands (c-Met, Eg5 neutral, SYK −1, Thrombin) can change a lot when one ligand moves.
- The FEP+ results are not a like-for-like workflow. They were produced with a different force field (OPLS4), a different sampling protocol, and per-target corrections for protonation states, tautomers and alternative ring flips that were applied by experts. RevFEP runs every target the same way with no manual corrections.
- Charged series are harder. The largest errors are on the +1 series (c-Met, Eg5) and on SHP2. The redocked c-Met run shows that the starting pose alone can move the RMSE from 1.87 to 0.70 kcal/mol for the same ligands.
- Not yet covered. BACE from the JACS set, and the other groups in Ross et al. (2023), have not been run with RevFEP.
Sources
- Wang, L. et al. Accurate and Reliable Prediction of Relative Ligand Binding Potency in Prospective Drug Discovery by Way of a Modern Free-Energy Calculation Protocol and Force Field. J. Am. Chem. Soc. 137, 2695–2703 (2015). doi:10.1021/ja512751q
- Schindler, C. E. M. et al. Large-Scale Assessment of Binding Free Energy Calculations in Active Drug Discovery Projects. J. Chem. Inf. Model. 60, 5457–5474 (2020). doi:10.1021/acs.jcim.0c00900
- Ross, G. A. et al. The maximal and current accuracy of rigorous protein-ligand binding free energy calculations. Commun. Chem. 6, 222 (2023). doi:10.1038/s42004-023-01019-9
- FEP+ 21-4 ligand predictions: schrodinger/public_binding_free_energy_benchmark,
21_4_results/ligand_predictions/