Documentation Index
Fetch the complete documentation index at: https://docs.revilico.bio/llms.txt
Use this file to discover all available pages before exploring further.
Why Use this product?
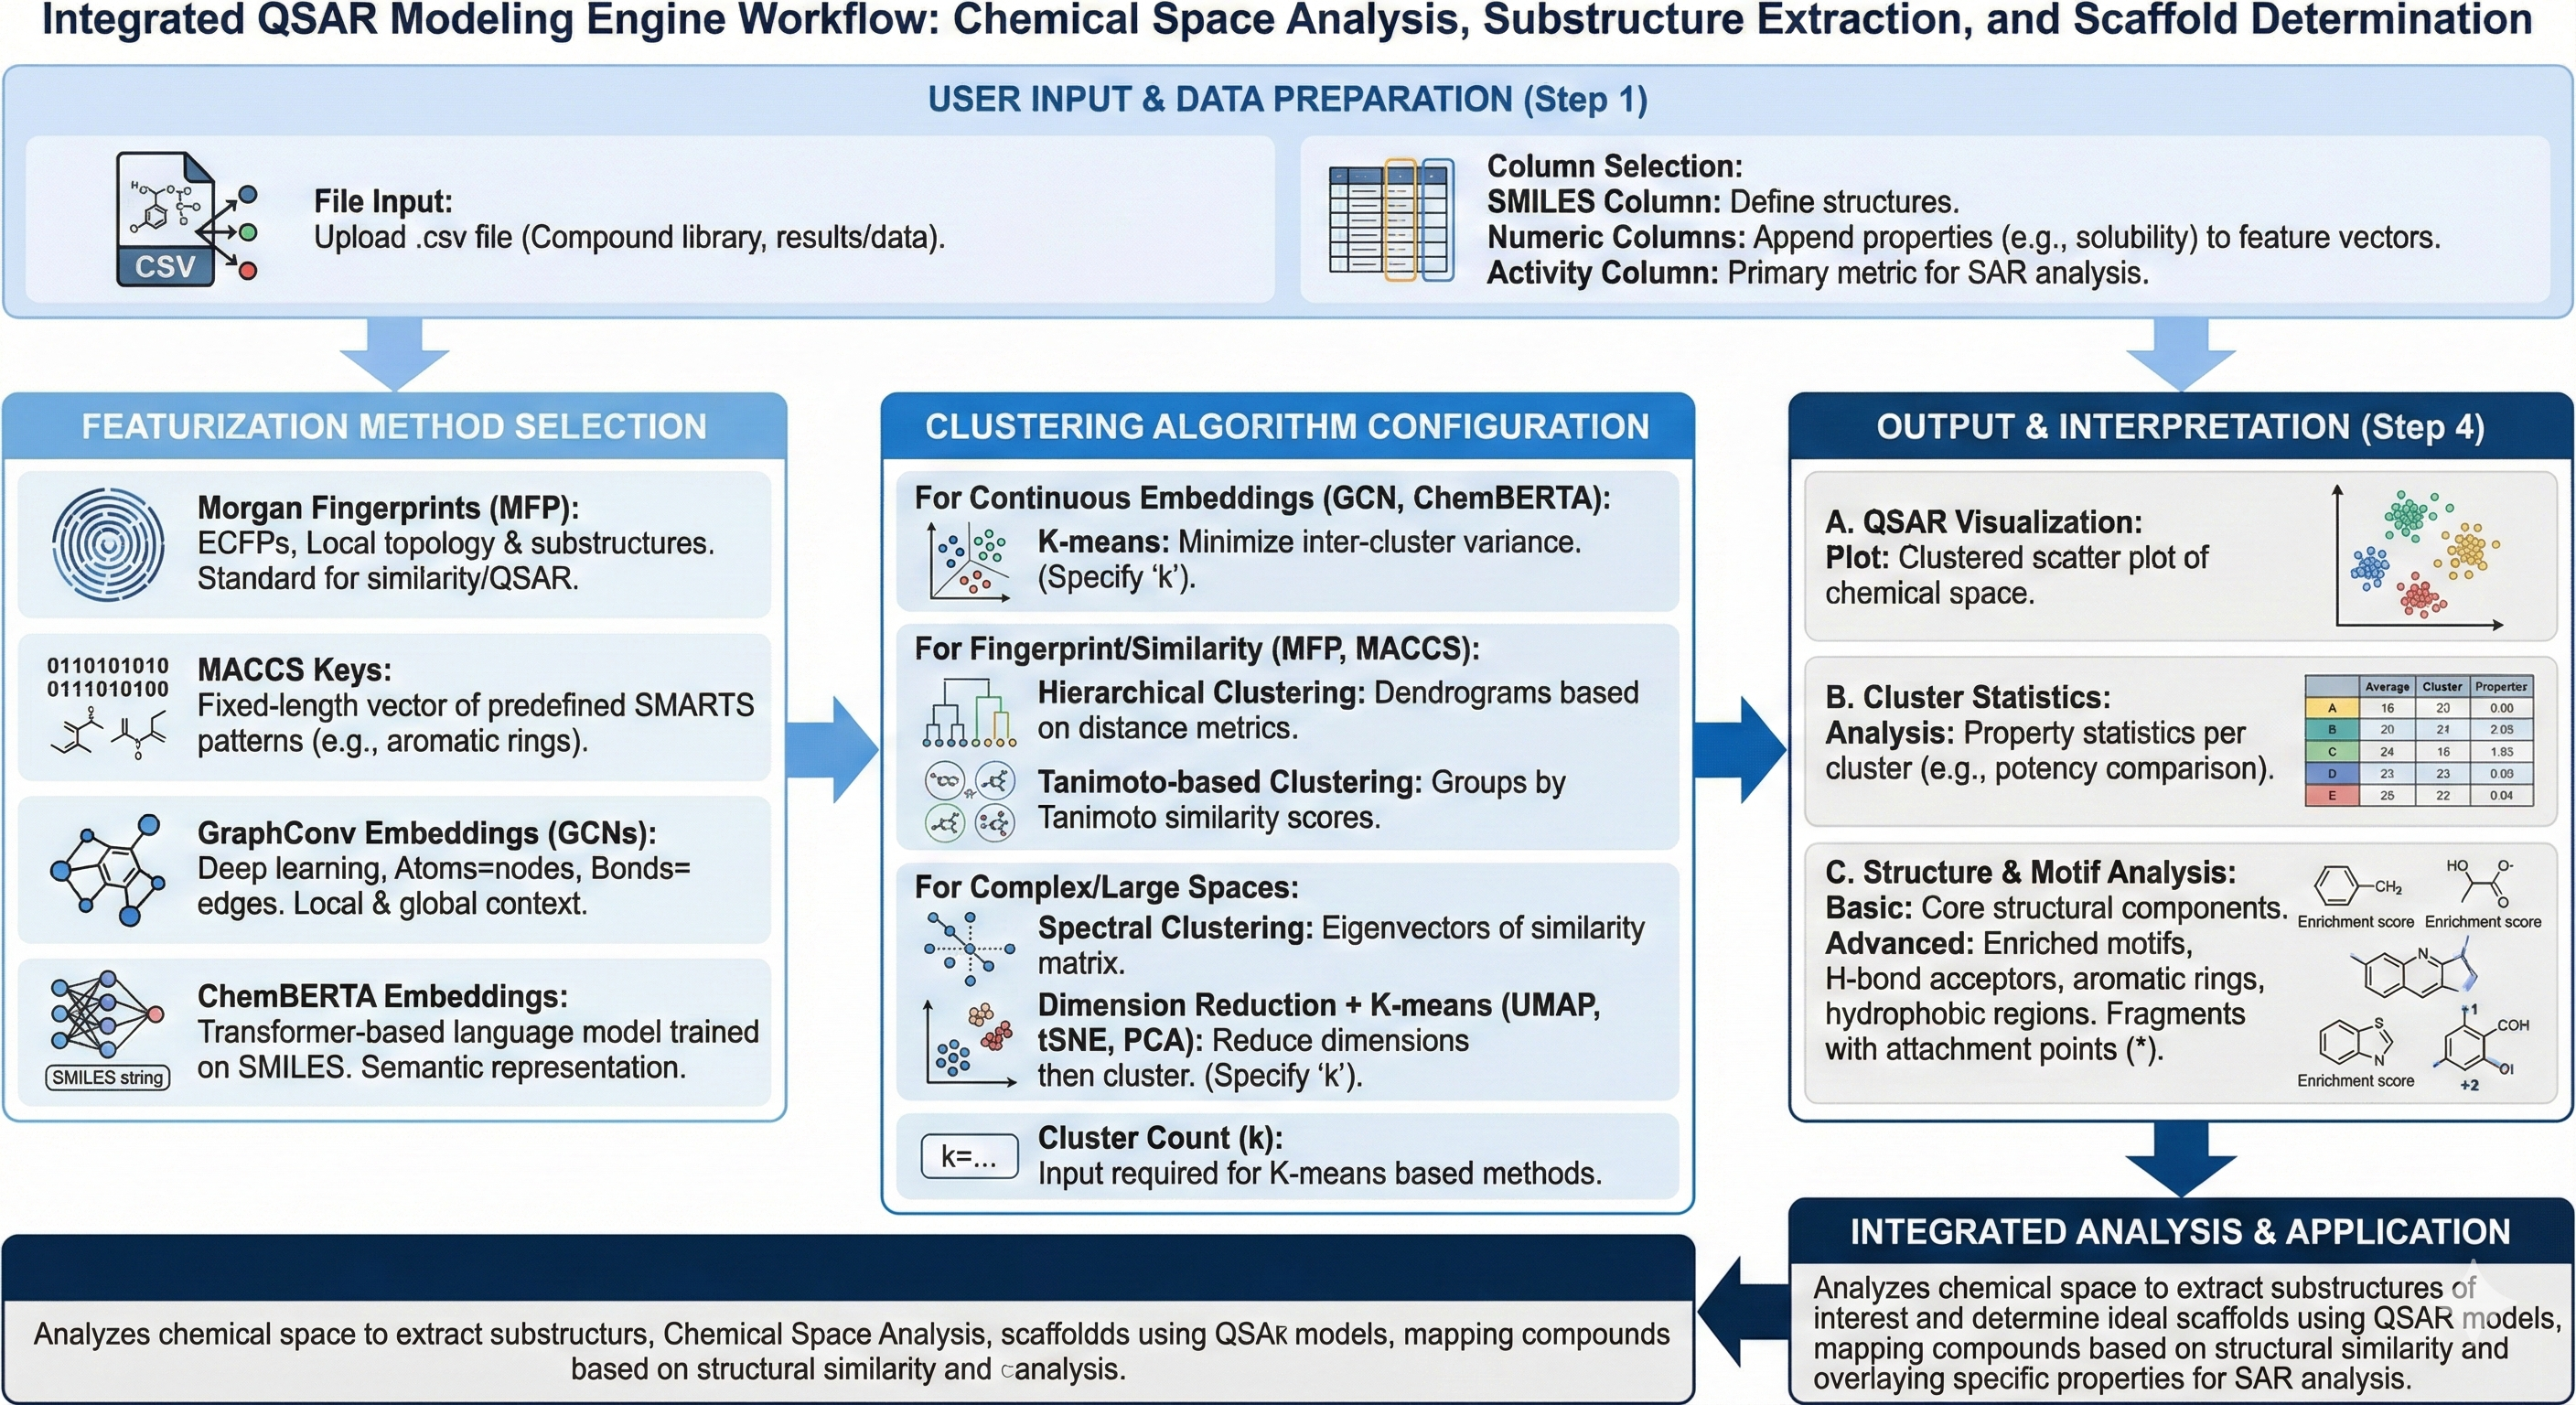
After retrieving a variety of different data types from your engines across the entire platform, you will likely end up with a matrix of SMILES strings and data points which need downstream processing and analysis. One method of understanding chemical similarities within clusters of high performing compounds is through the development of QSAR models that help you to analyze your chemical space, extract substructures of interest, and determine what your ideal scaffolds to preserve should be before moving into lead expansions. The way this model works is by taking and ingesting data collected from across the platform, extracting chemical feature representations of your molecules, and running them through different clustering modalities to explore chemical space in a data driven, intuitive way before moving into generative chemistry or lead expansion.
Background
Usually, when running something like a high throughput screen for collecting hits for your therapeutic campaign, you collect a lot of data that looks like a compound and its associated property values (for activity, solubility, etc.). Generally, what we can begin doing in later stage development flows is to take in this data for feature extraction and for analysis through clustering (which is a lower dimensional representation of chemical space). In other words, we can take a set of compounds and their determined properties and create a map of compounds that are grouped together based on how similar their structures are, and overlay the property of interest that you’d like to analyze to get a better understanding of what regions on the molecule, overlays, or substructures drive the certain properties that you are evaluating. In the case of activity, you usually have a portion of the molecule that is a critical driver of binding, and therefore needs to be preserved. With this technique, we can extract representative features from the SMILES structures themselves to understand what drives these properties.
When utilizing the algorithm, what is happening on the backend, is that the algorithm is ingesting your SMILES Strings along with numeric columns that represent your properties that you are interested in. Eventually, you will select your ‘featurization method’ which includes Morgan Fingerprints, MACCS Keys, GraphConv embeddings, or chemBERTA embeddings. Each embedding type provides specific benefits depending on the ‘task’ you are trying to predict and create representations about. For the above featurizers, Morgan Fingerprints (MFP) create extended connectivity fingerprints (ECFPs) that capture local topology and substructure patterns usually used for similarity searches, or QSAR. MACCS Keys are of fixed length and it decodes the structure of your molecule into a predefined SMARTS pattern (substructure like aromatic ring, carboxyl, etc) and is simple, but less expressive than MFP. GraphConv embeddings or Graph Convolutional Network embeddings (GCNs) are a deep learning representation where atoms are nodes and bonds are edges, helping to capture both local and global structural context where nonlinear relationships matter more. ChemBERTA embeddings are transformer based language models trained on SMILES Strings to learn contextual chemical representations, encoding semantic chemical language.
When selecting the clustering algorithm, it is important to note what your primary task is, what the nature of the chemical space is, and how you’d like to create lower dimensional representations for your chemical series. To begin, K-means clustering partitions molecules into k clusters by minimizing inter cluster variances and works best for continuous embeddings like GraphConv and chemBERTa rather than binary fingerprints like ECFP/MFP. Hierarchical clustering builds dendrograms by iteratively merging or splitting clusters based on distance metrics like tanimoto similarity or cosine similarities, without a pre-defined number of clusters(k), which is more common for fingerprint based similarity analysis. Spectral Clustering uses eigenvectors of the similarity matrix to perform clustering in a reduced ‘spectral’ space. This works best for non-spherical or complex cluster boundaries or anticipated continuous chemical spaces. Tanimoto based clustering is specialized for binary fingerprints like MFP/MACCS and uses the tanimoto similarity score to group molecules with shared substructure patterns and scaffolds.
Uniform Manifold Approximations and Projections (UMAP) and K-means is non-linear and preserves global and local structures and is best for larger chemical spaces of interest. T-distributed Stochastic Neighbor Embeddings (tSNE) and k mean emphasize local similarity and points close in high dimensional space remain close in the 2D and 3D projections, they are also non linear and emphasize local clusters and are best for visualization of the chemical space into distinct units. Principal Component Analysis (PCA) and k-means is a dimension reduction technique projecting data onto components that capture maximum variances, and is linear, fast, and an interpretable baseline for descriptor based clustering methods.