

Why Use This Engine?
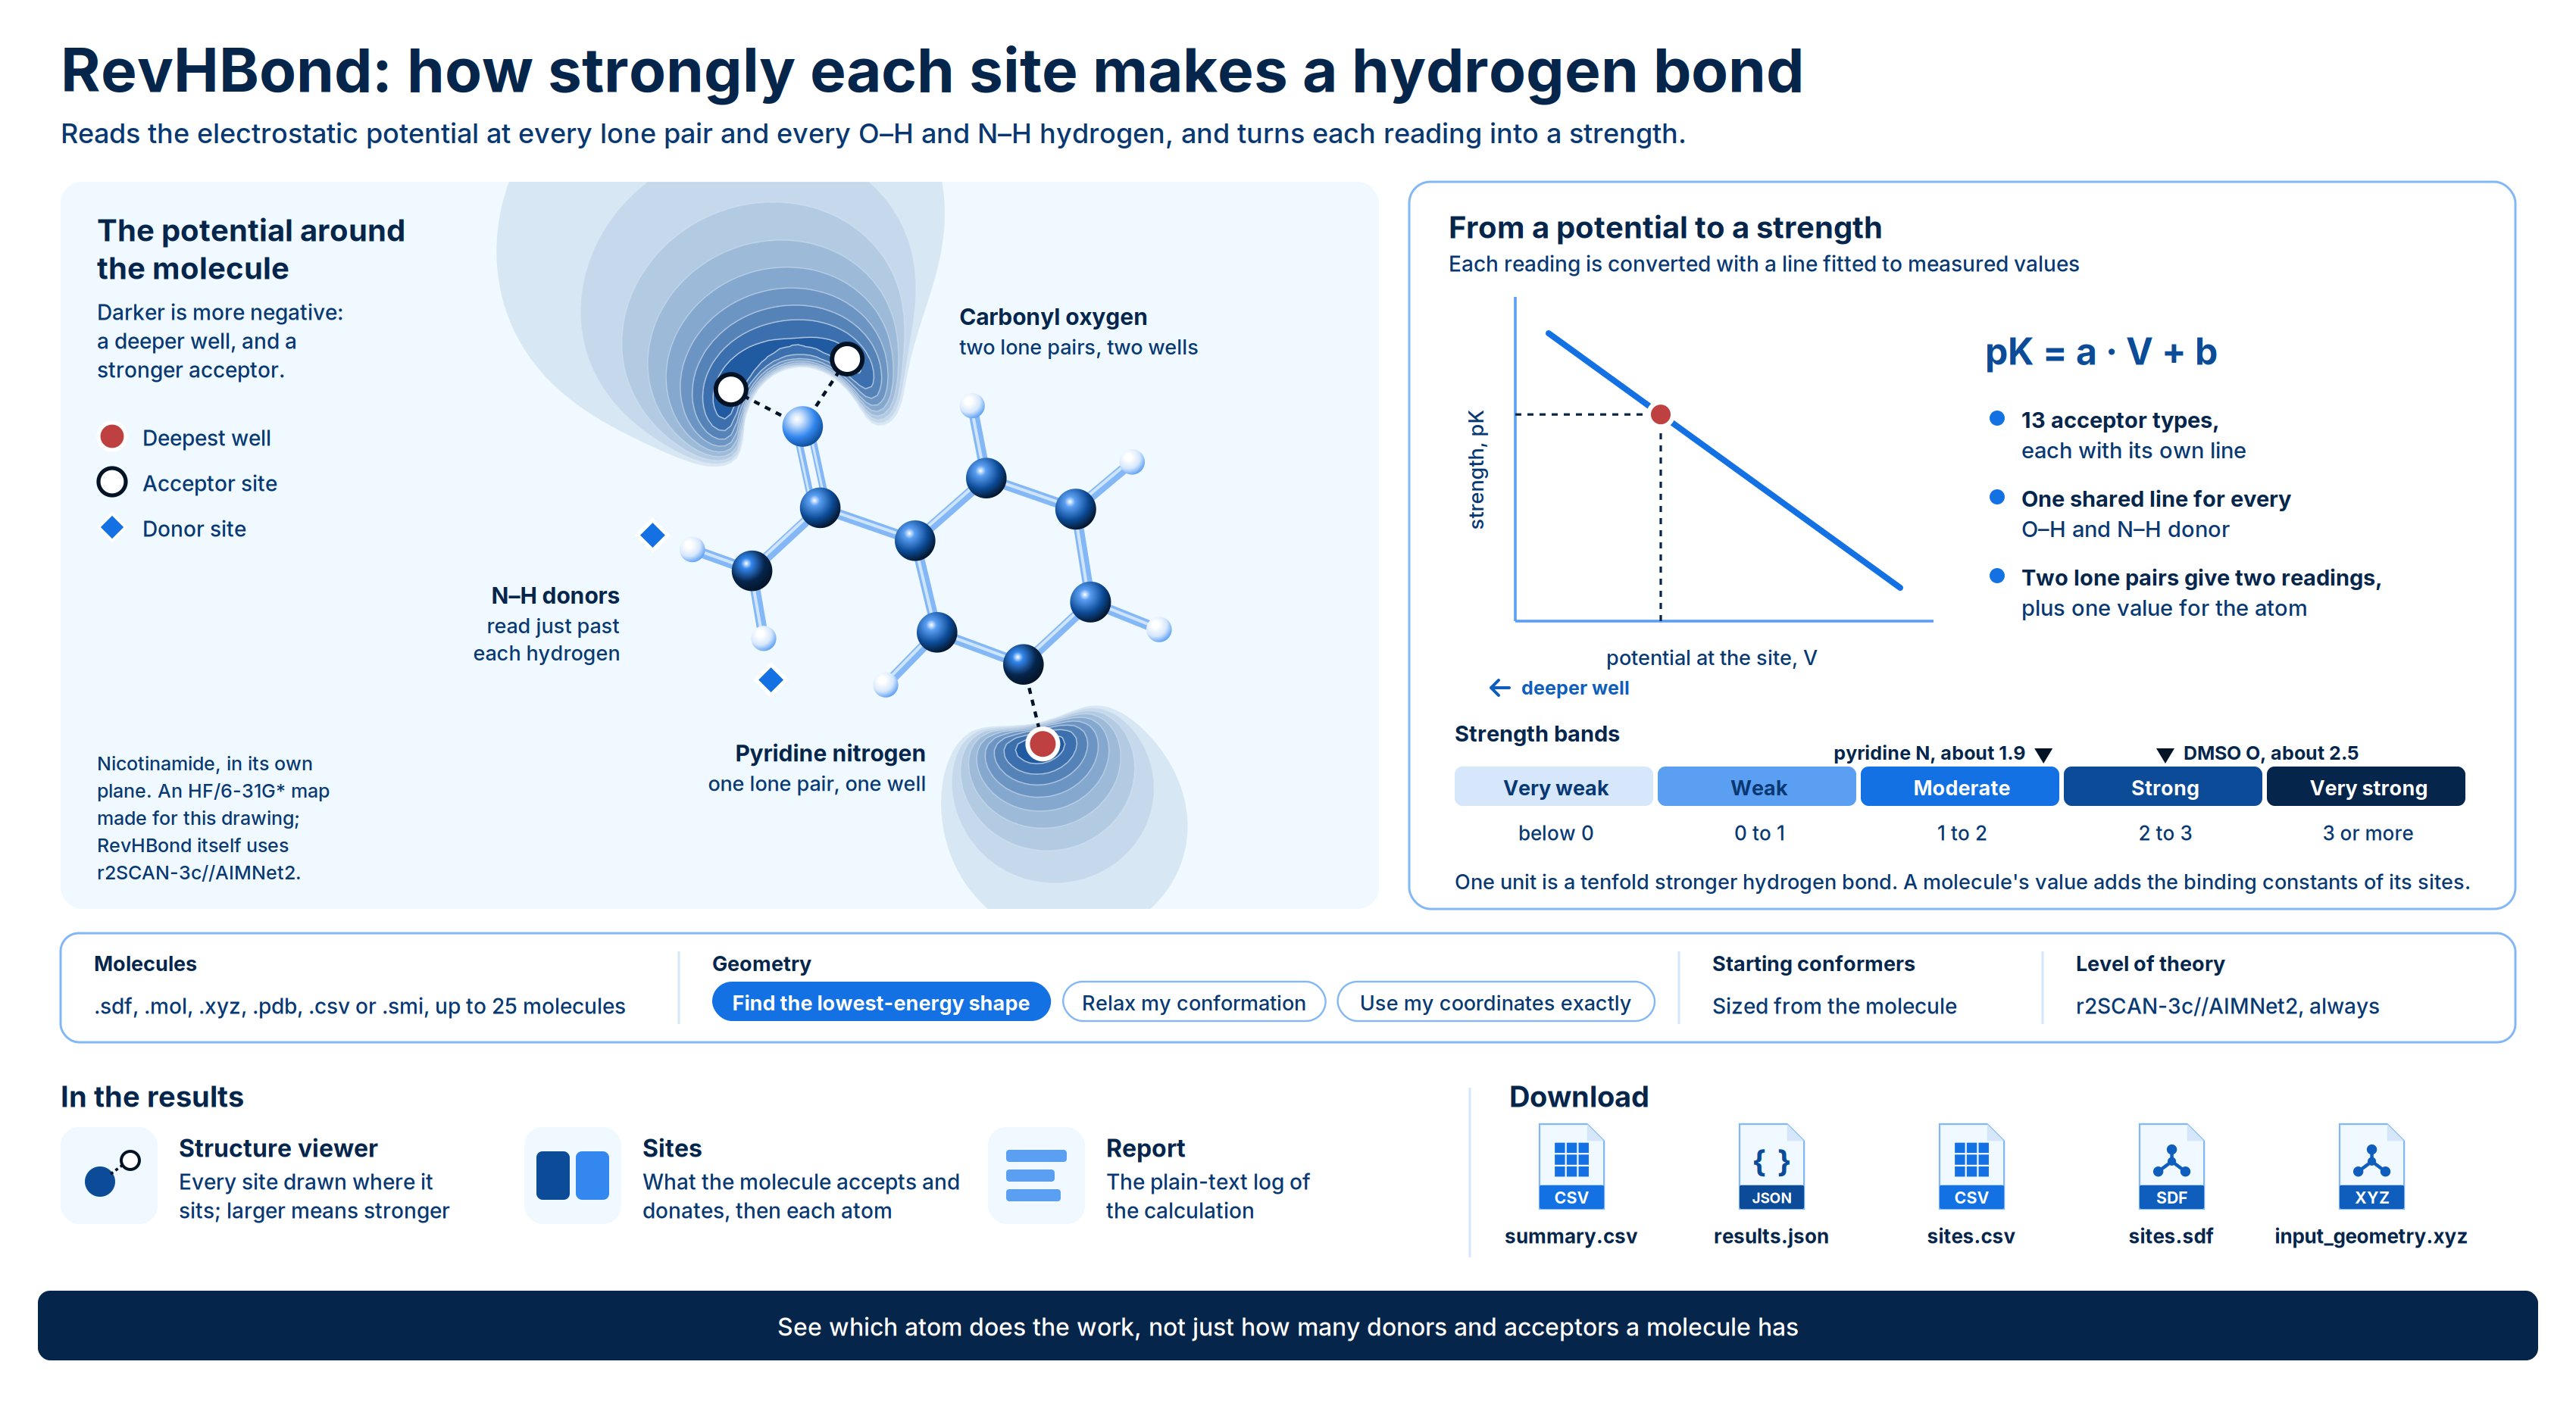
RevHBond predicts how strongly each part of a molecule forms hydrogen bonds. For every acceptor atom (a carbonyl oxygen, a pyridine nitrogen, an ether oxygen) it returns a pKBHX, and for every O–H and N–H hydrogen it returns a pKα. It also combines the sites into one acceptor value and one donor value for the whole molecule. Both numbers are log scales, so one unit is a tenfold stronger hydrogen bond. For reference, pyridine’s nitrogen accepts at about 1.9 and DMSO’s oxygen at about 2.5. Use RevHBond when you need to know which atom does the work, not just how many donors and acceptors a molecule has. Typical uses:- Tune permeability and efflux. Find the strongest acceptors and donors in a series, and check whether a change weakens the one that matters.
- Compare isosteres. Rank replacement groups by how strongly they accept or donate, on the same scale.
- Rationalize binding. Check whether an acceptor or donor in a ligand is strong enough to make a key contact with the protein.
- Rank a series. Sort molecules by overall acceptor or donor strength.
Background
A hydrogen bond links a hydrogen on an electronegative atom (the donor) to a lone pair on another atom (the acceptor). Its strength is usually measured as the equilibrium constant for forming a 1:1 complex with a reference partner. pKBHX is the standard acceptor scale: the base-10 logarithm of the binding constant with 4-fluorophenol in carbon tetrachloride. pKα is the matching scale for donors; it is not the acid dissociation constant pKa. Because both scales are logarithms, a site at 2.0 binds ten times more strongly than one at 1.0. RevHBond predicts these values from the molecule’s electrostatic potential, the energy a positive test charge would feel at each point around the molecule. A lone pair shows up as a minimum in the potential a little over an ångström in front of the acceptor atom. The deeper that minimum, the stronger the acceptor. For a donor, the potential is read at a probe point just past the hydrogen. The engine computes the potential once per molecule with density functional theory, reads it at each acceptor minimum and donor probe point, and converts each reading to a strength with a fitted line: where is the potential at the site, and and are fitted to measured values. Acceptors are split into 13 types, each with its own line (see Validation). Every O–H and N–H donor uses one shared line. An atom with two lone pairs, such as a carbonyl oxygen, has two minima. RevHBond reports each one, plus a value for the atom that combines them. The atom value is the number an experiment on that atom measures. The molecule-level value combines every site stronger than −1, because binding constants add: A molecule with several good acceptors is therefore a stronger acceptor overall than any one of its sites. Level of theory. The potential is always computed at r2SCAN-3c, on a geometry relaxed with the AIMNet2 machine-learned potential. RevHBond writes this asr2SCAN-3c//AIMNet2: potential on the left, geometry on the right. You can’t change the method. The calibration lines were fitted to potentials from this protocol only, and a potential from another method would turn into a confidently wrong answer.
Validation
RevHBond uses a published calibration (Wagen, ChemRxiv 2025, doi:10.26434/chemrxiv-2025-kv6d6-v2). Each acceptor line was fitted to measured pKBHX values. The table shows how many molecules each line rests on and how closely it reproduces them.
MAE and RMSE are in pKBHX units. Against measured values the method is typically within about 0.2 units. The worst cases are N-oxides and crowded amines: the calculation sees the amine’s lone pair as strong, but a partner has trouble reaching it.
The donor line rests on 41 measured compounds, far fewer than the acceptor lines. Read pKα values as a ranking more than as exact values.
These are the fit statistics of the published calibration. RevHBond has not been benchmarked separately against an external reference.
Running the Engine
Open Quantum Chemistry > RevQuant > RevHBond. The page has two tabs: H-Bond Strength to set up a run and Analysis to view results.1
Name the run
Enter a Name (optional, up to 200 characters). Runs without a name are called
Hydrogen-bond strength followed by the date.2
Add your molecules
Drop files on Molecules, or click to browse. You can also drag a file from the Data Engineering panel. Accepted formats are
.sdf, .mol, .xyz, .pdb, .csv and .smi. See Preparing input files.3
Choose where the geometry comes from
Select a Geometry option. The default, Find the lowest-energy shape, is the right choice for a molecule on its own. The Level of theory strip shows the resulting protocol, such as
r2SCAN-3c//AIMNet2. See Geometry options.4
Adjust advanced settings (optional)
Open Advanced Options to set the number of Starting conformers, or the Charge for an XYZ file.
5
Set a runtime limit (optional)
Enter a Runtime Limit (Credits) to cap what the run can spend. Leave it blank to run until completion. See Run time and credits.
6
Run the calculation
Click Run calculation, then Confirm. A notification shows how many molecules were submitted and the level of theory, and the page switches to the Analysis tab with your run selected.
Inputs
You can’t choose the method or basis set. The potential is always computed at r2SCAN-3c, because the calibration is valid only for that protocol.
Geometry options
The electrostatic potential depends on the molecule’s shape, so the Geometry setting decides which shape the strengths describe.Relax my conformation shows a warning before you submit: without a conformer search, the submitted conformation is kept. For a molecule on its own, the calibration assumes the lowest-energy conformer.
Preparing input files
Submit the neutral form of each molecule: the free base, not the salt. The calibration covers neutral molecules only. A charged molecule fails with that reason rather than returning numbers that look plausible but are wrong. CSV or SMI (SMILES). SMILES carry no 3D shape, so one is generated with a force field. Use Find the lowest-energy shape for SMILES input. Use my coordinates exactly isn’t available, because there are no coordinates to keep. With Relax my conformation, the form warns you that the force-field shape is the starting point. SDF. An SDF can hold many molecules, one per record. MOL, XYZ or PDB. One molecule per file. You can select several of these files at once, up to 25. To submit many molecules in other formats, use a multi-record SDF or a CSV instead. XYZ. An XYZ file states no bonds or charge. If the molecule isn’t neutral, set Charge under Advanced Options so the bonds can be worked out. Every other format carries its own charge. Atom numbers in the results follow the order of atoms in your input file.Run time and credits
Each molecule needs a conformer search and one DFT calculation. Expect about a minute for a small molecule and about ten minutes for a drug-sized one. A run processes one molecule at a time, so the total time grows with the number of molecules. Finished molecules are saved as they complete. RevHBond bills 1 credit per minute of runtime while the calculation runs. You need enough credits to start a run.- Leave Runtime Limit (Credits) blank to run until the calculation finishes, with no cap.
- Set a limit to cap the spend. When the run reaches it, the run stops with the status
terminated_budget_exceeded.
Viewing Results
Open the Analysis tab and click a run in the list. Click Change Pipeline to go back to the list. A run that is still in progress shows its percentage complete and refreshes automatically every 10 seconds. A run that failed or was stopped shows the reason.Run statuses
The run header shows the level of theory, how many molecules completed out of the total, how many failed, and the total runtime.
Molecule table
The table lists one row per molecule. Click a column heading to sort by it. Click a row to open that molecule’s detail above the table; the first completed molecule opens automatically.
Values are shown to two decimals, since the calibration is good to about 0.2 units. If any molecule failed, turn on Failures only to list just those.
Structure viewer
The Structure panel shows the molecule in 3D with every hydrogen-bond site drawn where it sits.- Acceptor sites are spheres at each potential minimum, in front of the lone pair, joined to their atom by a dashed stick. The stick shows the direction a hydrogen bond would come in from.
- Donor sites are blue spheres at the probe point just past the hydrogen.
- Larger spheres are stronger sites. Labels give the atom and its value.
The bands are a reading aid, not part of the calculation.
Use Both, Acceptors or Donors to choose which sites to draw. Sites weaker than −1 are hidden by default; click Hiding sites below −1 to show them. Click a site in the Sites tab to highlight it in the viewer.
Switch between Computed geometry, the shape the sites were calculated on, and As submitted, your uploaded structure. As submitted is available only when the geometry was optimized or searched, and it shows no sites. Click SDF or XYZ to download the structure in view.
Sites tab
Two headline values give the molecule-level Accepts (pKBHX) and Donates (pKα), each with its strength band. A molecule with no site above −1 shows “no site above −1”. Acceptors lists every acceptor atom of a calibrated type:
Donors lists every O–H and N–H hydrogen, with the hydrogen’s atom number (Hydrogen), the atom it’s bonded to (On) and its pKα.
Click Sites CSV to download every acceptor minimum and donor hydrogen for this molecule.
Molecule tab
Shows any warnings for the molecule and how the numbers were made:Report tab
The full plain-text calculation log for the molecule.Downloads
Click Download in the run header to get two files for the run.{name} is the run name, with spaces and special characters replaced by underscores.
{name}-summary.csv: one row per molecule. Columns includeindex,name,formula,smiles,molecular_pkbhx,strongest_acceptor_atom,strongest_acceptor_class,strongest_acceptor_pkbhx,molecular_pk_alpha,strongest_donor_atom,strongest_donor_pk_alpha,geometry_source,statusanderror.{name}-results.json: the full batch document, with the run settings, counts and every site.
Limits
- Up to 25 molecules per run, 25 MB per file and 100 atoms per molecule, hydrogens included.
- Neutral molecules only. Submit the free base, not the salt.
- Elements are limited to those AIMNet2 covers: H, B, C, N, O, F, Si, P, S, Cl, As, Se, Br and I.
- The level of theory is fixed at
r2SCAN-3con an AIMNet2 geometry (or your submitted geometry). - Only acceptors of the 13 calibrated types are scored. A molecule with none shows “No acceptor of a calibrated type in this molecule”.
- Only O–H and N–H hydrogens are scored as donors. S–H is not scored and is left out of the molecule-level donor value.
- Sites weaker than −1 are left out of the molecule-level values.
- The donor calibration rests on 41 compounds; use pKα mainly to rank sites.
- Predictions are least reliable for N-oxides, pnictogen oxides and sterically crowded amines.