

Why Use This Engine?
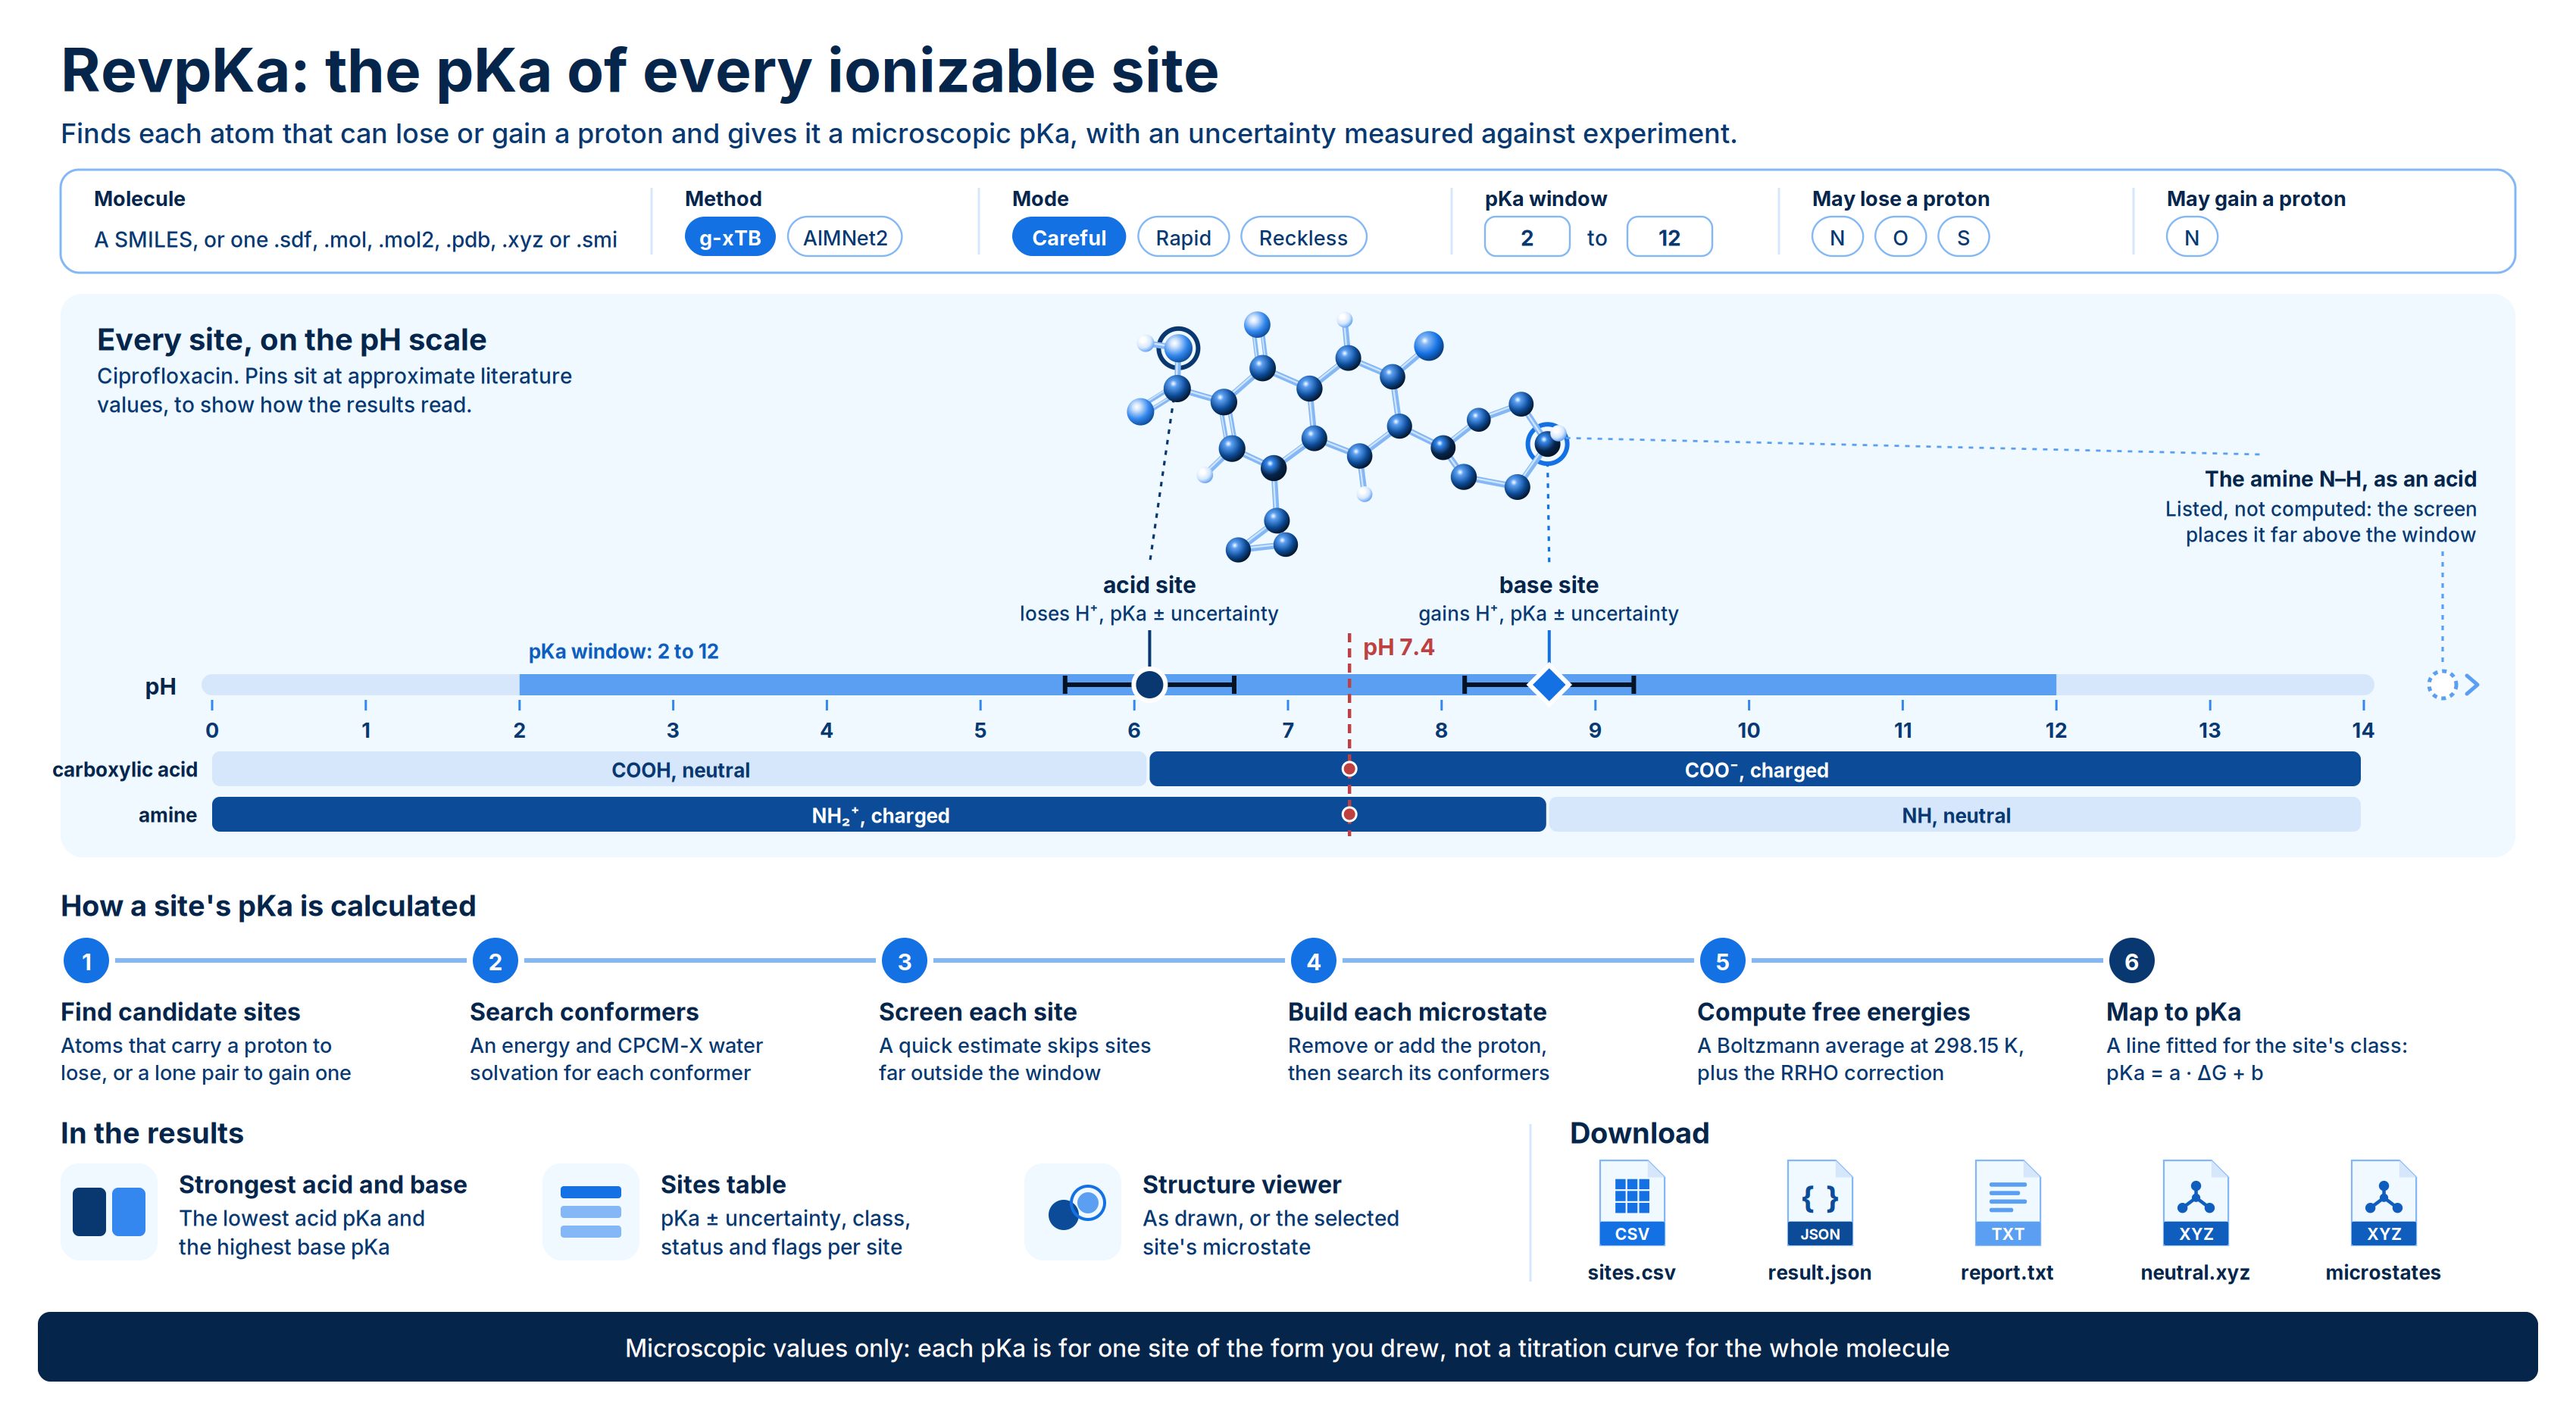
RevpKa predicts the microscopic pKa of each site in one molecule. It finds every atom that can lose a proton (an acid site) or gain one (a base site) and gives you a pKa for each, with an uncertainty measured against experiment for that kind of site. Each value comes from a physics calculation: conformer search, g-xTB or AIMNet2 energies, CPCM-X water solvation and thermal corrections. A correction line fitted on measured aqueous pKa then turns that result into a pKa. Use RevpKa when you need to know which atoms in a molecule ionize, and how easily. Typical uses:- Find the ionizable centres. See which nitrogens, oxygens and sulfurs protonate or deprotonate between pH 2 and 12, and which do not.
- Predict the charge state at physiological pH. The strongest acid and strongest base values tell you which groups carry a charge near pH 7.4.
- Compare analogs. See how a substituent shifts the basicity of an amine or the acidity of a phenol across a series.
- Check a protonation state before other calculations. Confirm the form you draw for docking, MD or quantum chemistry is the one that dominates in water.
Background
Microscopic and macroscopic pKa
For a single site, the acid dissociation equilibrium is A microscopic pKa describes one site in one specific protonation state and tautomer: it is the pKa of that atom losing or gaining a proton while the rest of the molecule stays as drawn. A macroscopic pKa is what a titration measures. It describes the molecule as a whole, and when several sites can lose a proton from the same state, the macroscopic constant sums the microscopic ones: RevpKa reports microscopic values only. It computes the protonation state and tautomer you draw, and does not combine sites or tautomers into a titration curve. For a molecule with a single ionizable site in range, the microscopic and macroscopic values coincide.How a site’s pKa is calculated
- Find candidate sites. An atom of an element you allow to lose a proton, and that carries one, is an acid site. An atom of an element you allow to gain a proton, and that has a free lone pair, is a base site. Aromatic nitrogens whose lone pair is part of the ring’s π system (as in pyrrole) are not protonated. Symmetry-equivalent atoms, such as the two oxygens of a carboxylate, are computed once and reported together.
- Search conformers. The molecule as drawn is embedded in 3D, its conformers are optimized, and each one’s energy and CPCM-X water solvation free energy are computed.
- Screen each site. A quick estimate from a single conformer decides whether a site is worth the full calculation. Sites whose estimate falls outside the pKa window plus a buffer are listed as not computed, with the estimate.
- Build each microstate. For every remaining site, the engine removes or adds the proton and searches conformers of that microstate.
- Compute free energies. The free energy of each state is a Boltzmann average over its conformers at 298.15 K, plus the thermal (RRHO) correction of the lowest conformer:
- Map to pKa. The free energy change between the deprotonated and protonated forms, , is mapped to a pKa by a straight line fitted for that site’s class (its functional-group type):
[NH3+]CC(=O)[O-], is optimized with its heteroatom–hydrogen bonds held in place and flagged as lower confidence.
Validation
Both methods are calibrated separately against experimental aqueous pKa values. The data are the monoprotic test sets of Baltruschat and Czodrowski (2020): literature values and in-house measurements contributed by Novartis, CC BY 4.0, each with one experimental pKa between 2 and 12. Accuracy is reported as 5-fold cross-validated error, so every prediction is scored on molecules left out of the fit.
Accuracy differs by site class. The ± shown next to each pKa is its class’s cross-validated RMSE:
Sites in any other class, or in a class a method has no line for, are reported as not calibrated for this site type, with a free energy but no pKa. The correction lines were fitted in Careful mode. Reckless mode has never been validated against measured pKa.
Running the Engine
Open Quantum Chemistry > RevQuant > RevpKa. The page has two tabs: Calculation to set up a run and Analysis to view results.1
Name the run
Enter a Name (optional, up to 200 characters). A run without a name is called
RevpKa followed by the SMILES or file name.2
Add your molecule
Under Molecule, choose SMILES and type a SMILES, or choose Structure file and drop a file, click to browse, or drag one in from the Data Engineering panel. Accepted formats are
.sdf, .mol, .mol2, .pdb, .xyz and .smi, up to 10 MB. See Preparing your input.3
Set the charge (optional)
Leave Charge empty to take it from the structure’s formal charges. If you set it, it must agree with them.
4
Choose a method and mode
Select a Method and a Mode. If your molecule contains an element a method does not cover, that method is greyed out with the reason.
5
Choose which sites to consider
Set the pKa window and the elements under Elements that may lose a proton and Elements that may gain a proton. To compute only specific atoms, or to change the screening buffer, open Specific atoms and buffer.
6
Set a runtime limit (optional)
Enter a Runtime Limit (Credits) to cap what the run can spend, or leave it blank for no cap.
7
Run the calculation
Click Run pKa calculation, then Confirm. A notification shows the number of candidate sites and the estimated run time, and the page switches to the Analysis tab with your run selected.
Inputs
Preparing your input
Draw the protonation state you mean. The state you submit is the one computed, and every site’s pKa refers to it. Draw a zwitterion as a zwitterion. If the molecule has other tautomers, the results carry a warning, because a pKa can shift by more than a unit in another tautomer. One molecule per run. A SMILES with a. (a salt, or more than one component), an SDF with more than one record, or a .smi file with more than one SMILES is refused. Remove counterions before you submit.
Atom numbering. Sites are reported by element and 1-based atom number, such as N8. The numbers follow your input:
Use the same numbering for Only these atoms lose a proton and Only these atoms gain a proton.
File formats. SDF and MOL are the safest structure files, because they carry bonds and formal charges, and a pKa site is a statement about bonding. For PDB files, bond orders are guessed. XYZ files work when bonding can be read from the geometry.
Choosing a method
Both methods are calibrated, and their accuracy is close (see Validation). The same molecule can differ by a pKa unit between the two methods, so compare values only within one method. The runs list shows which method produced each run.
Modes
The mode sets how many conformers are searched for each protonation state and the default screening buffer.Run time and credits
Run time grows with molecule size, roughly as the number of atoms to the power 2.75 for each protonation state, and with the number of candidate sites. Measured times with g-xTB in Careful mode:
When you submit, the run time is estimated from the molecule’s size and its candidate sites. A job predicted to run longer than 8 hours is refused, and the message tells you what to change: a faster mode, the g-xTB method if you chose AIMNet2, or naming only the sites you care about under Specific atoms and buffer.
RevpKa bills 1 credit per minute of runtime while the run is in progress. Leave Runtime Limit (Credits) blank for no cap, or set it to stop the run when it reaches that many credits; the run then ends with status
terminated_budget_exceeded. You need enough credits to start: at least the limit you set, or 10 credits when you leave it blank.
Viewing Results
Open the Analysis tab and click a run in the list. Each row shows the run’s status and the method it used. While a run is in progress, the results area shows its percentage complete and refreshes every 10 seconds. Click Change Pipeline to pick a different run.Run statuses
A
processed run also has a scientific outcome:
- Completed. Every computed site has a pKa from a calibrated correction line. No badge is shown.
- Questionable. The numbers are real, but something qualifies them: a site type with no correction line, conformers dropped because a proton moved, a protonation state held in place, or a site that could not be computed. An amber Some of these values need care notice appears above the sites table, and the affected sites carry flags. No badge is shown.
- Failed. No usable result. A red Failed badge and the error are shown.
AIMNet2 does not converge on every molecule. If an AIMNet2 run produces no pKa values, run the same molecule with g-xTB.
Results
The header shows the method and mode, the pKa window and the total run time. Click About this method for a description of the calculation and the provenance of the energies, solvation model, thermal corrections and correction table, including the dataset attribution. Strongest acid and strongest base. Two cards show the lowest pKa among the acid sites and the highest pKa among the base sites. A card reads none computed when no site of that kind has a pKa. Sites table. One row per candidate site, including those that were not computed. Any warnings about the whole molecule, such as other tautomers or a zwitterion optimized with its protons held, are listed above the table. Click a row to mark that site on the structure.
Structure viewer. A 3D view of the molecule with the selected site marked: acid sites in orange, base sites in purple, with symmetry-equivalent atoms shaded. As drawn shows your input molecule. The second button, such as N8 protonated or O4 deprotonated, shows that site’s microstate; for a base site, the added proton is the small purple atom. The viewer shows the lowest-free-energy conformer of each ensemble.
Downloads
Click Download in the results header. Each file opens in a new browser tab. File names start with the run name, with spaces and special characters replaced by_:
{name}-sites.csv: one row per candidate site, computed or not, with the columnsatom_index,element,kind(acidorbase),status(computed,uncalibrated,failedornot computed),pka,pka_uncertainty,delta_g_kcal_per_mol,functional_group,conformers,equivalent_atoms,screening_estimate_pka,flagsandreason. Empty cells mean no value;equivalent_atomsandflagsare space-separated lists.{name}-result.json: the full result document, with the settings, status, every site and its conformers, the sites not computed, warnings and provenance.{name}-report.txt: a human-readable summary of the run, with warnings last.{name}-neutral.xyz: the conformers of your input molecule, lowest free energy first.{name}-microstates-{kind}_{site}.xyz: one file per computed site, such as{name}-microstates-base_N8.xyz, holding that microstate’s conformers, lowest free energy first.
Limits
- One molecule per run, up to 60 heavy atoms and 10 MB per file.
- Charge from -10 to 10.
- Jobs predicted to take more than 8 hours are refused at submission.
- Water at 298.15 K only, with the CPCM-X solvation model.
- Microscopic pKa only: values refer to the protonation state and tautomer you draw. Macroscopic pKa and tautomer averaging are not computed.
- pKa values are reported only for site classes with a fitted correction line. The calibration data span pKa 2 to 12.
- AIMNet2 covers 14 elements and was calibrated on molecules of up to 45 atoms.