The Problem You are Trying to Solve:
“I have a known drug (ligand) and a target (protein) complex with demonstrated efficacy, and I want to identify which cell line will show the best therapeutic response based on its molecular profile.”
Identifying The Best Therapeutic Cell Line For A Drug Target
Complex
Traditionally, identifying optimal cell lines for drug-target complexes required expensive, time-consuming wet-lab screens across dozens of cell lines, with each requiring weeks of cell culture, drug treatment, and phenotypic assays to measure therapeutic response. This empirical approach provided limited mechanistic insight into why certain cell lines responded better, making it difficult to predict responsiveness in new contexts or optimize for specific biological outcomes. The lack of comprehensive transcriptome profiling meant researchers often missed critical regulatory networks and temporal dynamics that govern drug response, leading to suboptimal cell line selection and failed validation experiments. Solution
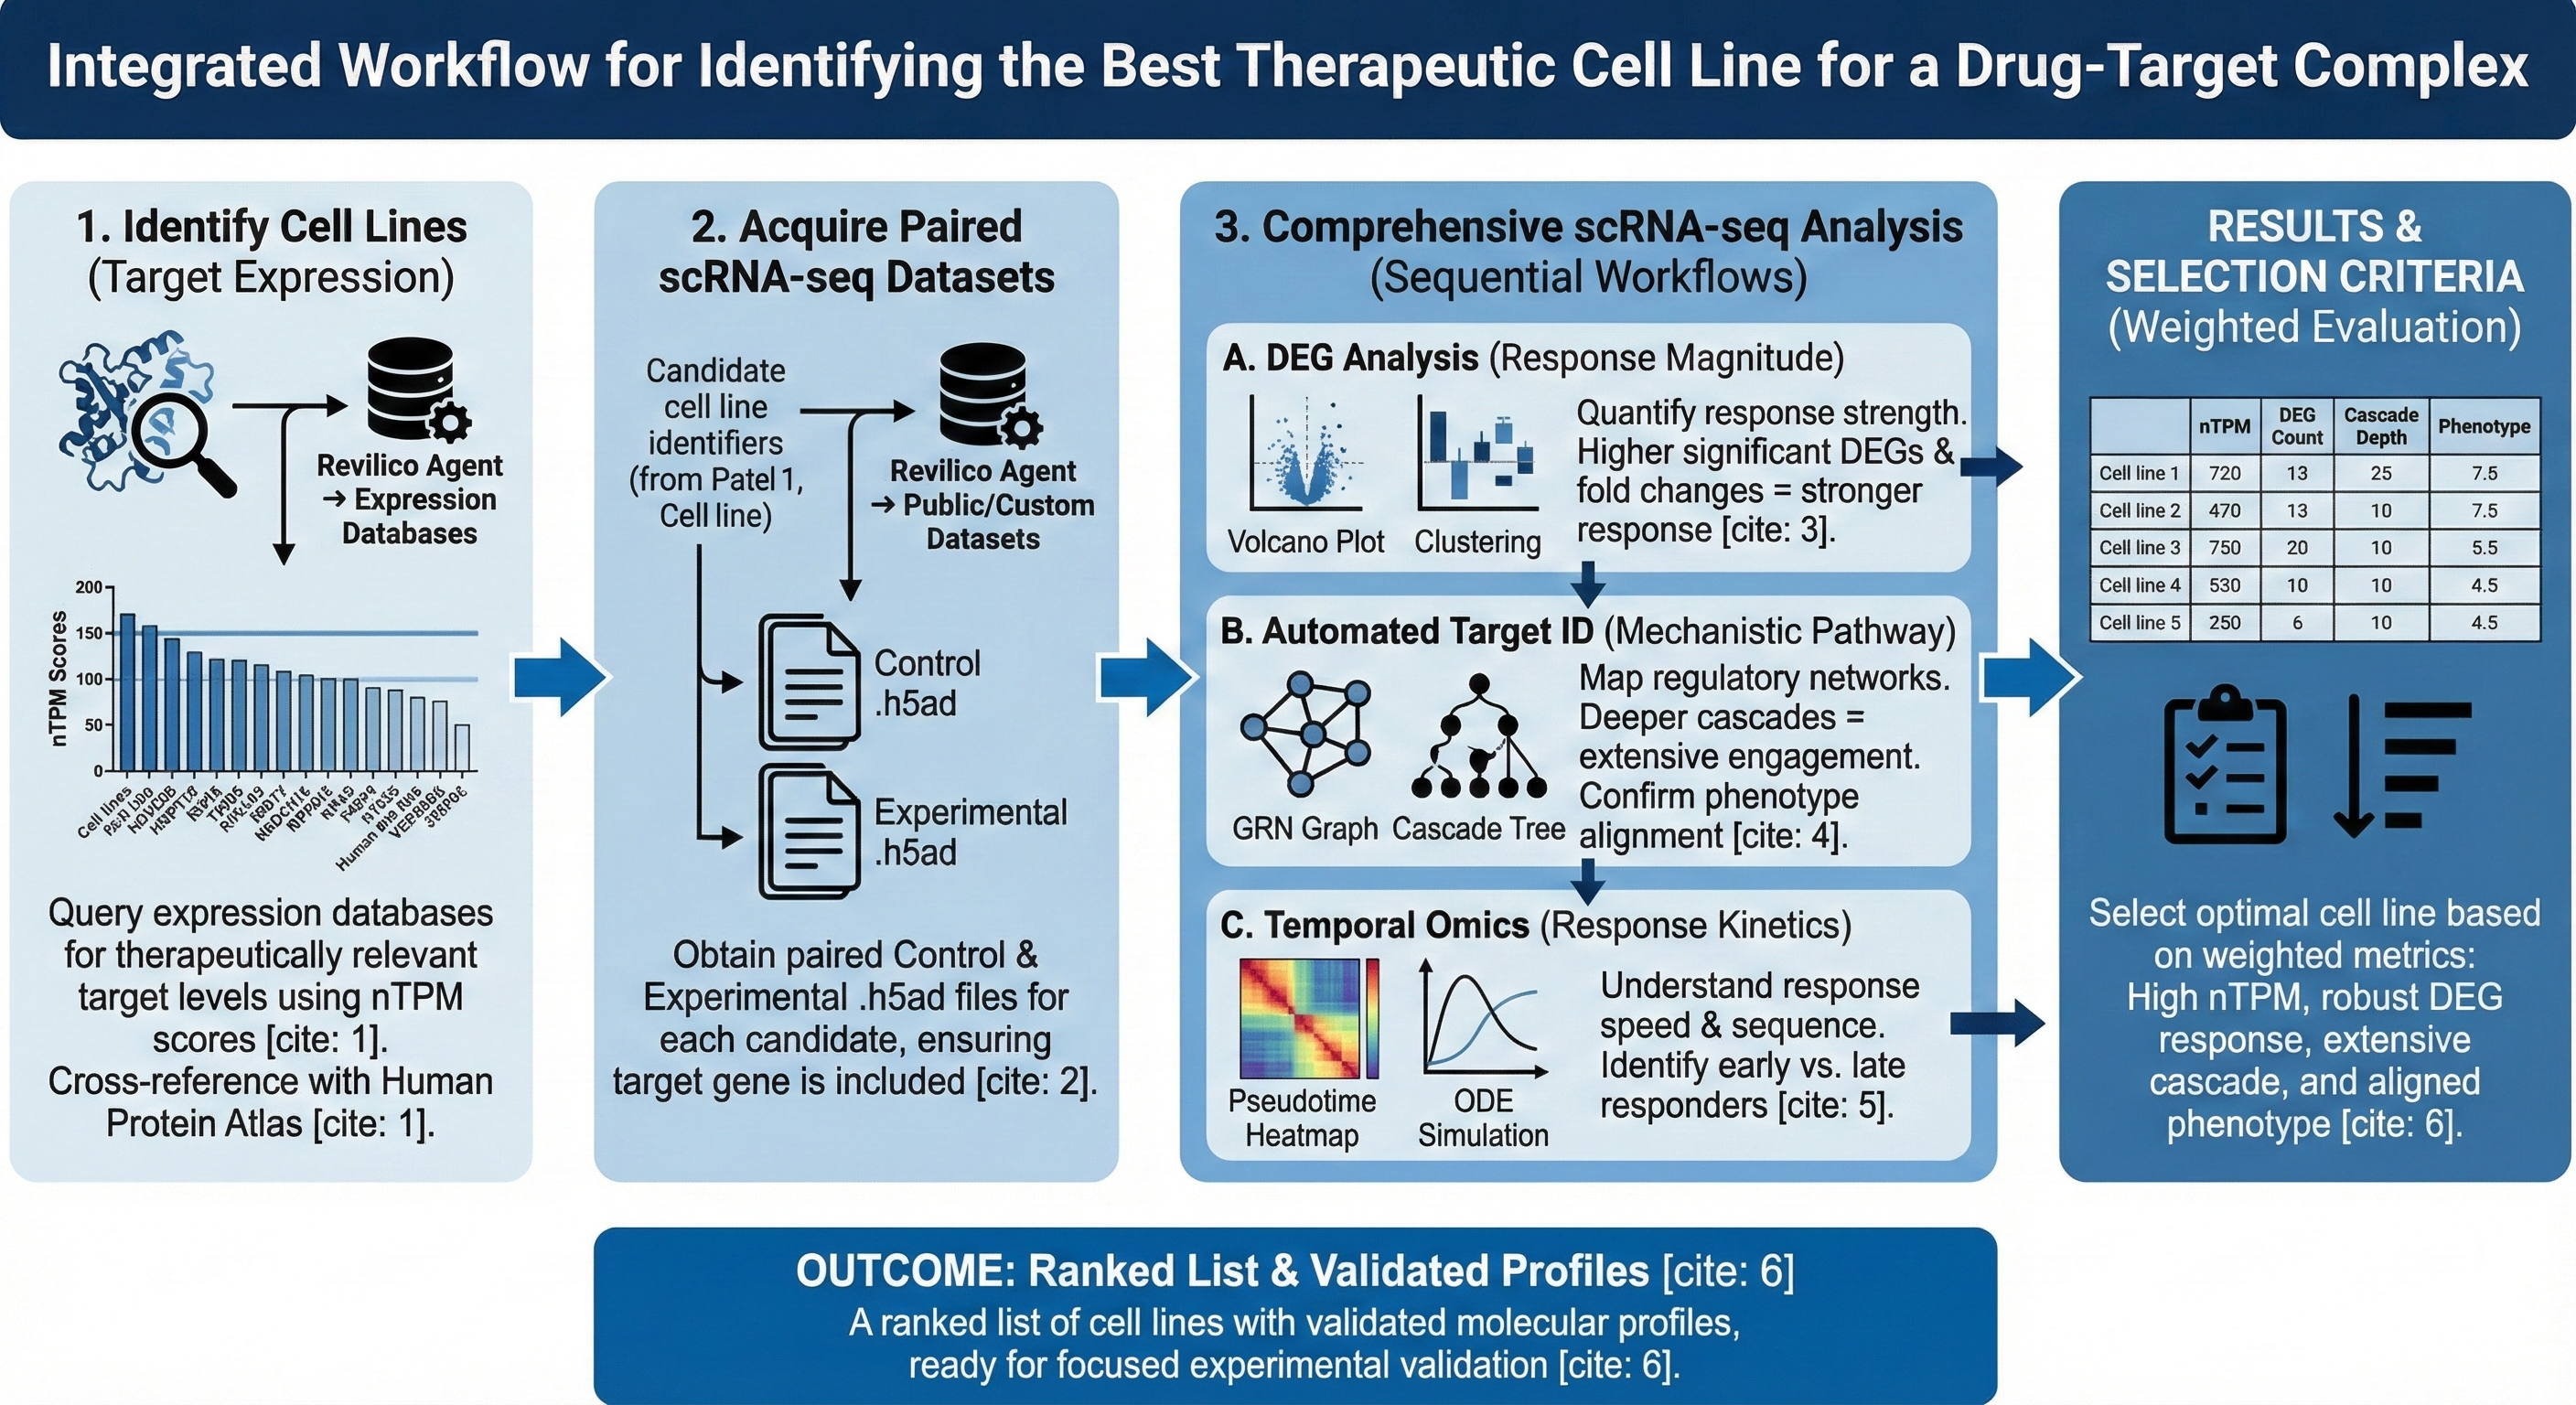
This workflow enables users to a) systematically identify cell lines with optimal therapeutic response potential through target expression profiling and b) comprehensively characterize the molecular mechanisms driving drug efficacy using multi-modal transcriptome analysis across Revilico’s scRNA-seq Analysis Engine. We leverage three complementary analytic workflows, DEG Analysis for response magnitude assessment, Automated Target ID for regulatory network mapping, and Temporal Omics for response kinetics to ensure complete characterization of cellular response dynamics.
What Data Do I Need to Provide?
  • Protein name or identifier (Required to identify cell line candidates to evaluate)
Workflow
  1. Identify Cell Lines based on Target Expression
Determine which cell lines express your target protein at therapeutically relevant levels. To do this on Revilico, users can leverage Revilico Agent to query expression databases and identify candidates based on normalized transcript abundance (nTPM scores) Sample Query for General Screening: I have the protein AXL. I want to identify the top 20 cell lines based on nTPM scores. Sample Query for Disease-Specific Screening: I have the protein AXL. I want to identify the top 20 cell lines associated with Triple Negative Breast Cancer based on nTPM scores. Revilico Agent will output a ranked list of cell lines with corresponding expression levels. Users can cross-validate these results using the Human Protein Atlas Database by searching for the target protein and reviewing associated cell lines. High expression generally indicates the target is biologically active in that cellular context, making it a strong candidate for therapeutic response studies
  1. Acquire Paired scRNA-seq Datasets
Obtain control and experimental scRNA-seq datasets for each candidate cell line that include your target gene. Users leverage Revilico Agent to source publicly available datasets in h5ad format, ensuring both baseline and treatment conditions are represented. Sample Query: I have these cell lines that I have identified: [list]. Please provide me a panel of scRNA-seq datasets in the format of h5ad files for each cell line. For each cell line, the h5ad files should come in pairs, one control sample and one experimental sample. Ensure that these h5ad files include our target gene as well. Revilico Agent will output matched control-experimental h5ad file pairs for each cell line, verified to contain your target gene in the expression matrix. These paired datasets represent the transcriptomic state before and after perturbation, enabling comparative analysis of cellular response. If suitable public datasets are unavailable, user can query from Gene Expression Omnibus or have to generate custom scRNA-seq data, or refine their cell line selection criteria based on data availability.
  1. Run Comprehensive scRNA-seq Analysis
Execute all three analytic workflows within Revilico’s scRNA-seq Analysis engine sequentially for each control-experimental h5ad pair using your selected or generated gene panel. This mullti-modal analysis provides complementary perspectives on therapeutic response. The DEG Analysis will provide a response magnitude assessment. Here we will identify whether or how strongly each cell line responds at the transcriptomic level. Here volcano plots reveal statistical significant gene expression changes, clustering visualizations show distinct transcriptomic states between control and experimental conditions, and pathway enrichment analyses identify affected biological processes. To further understand how to interpret the outputted graphs, you can refer to the engine specific documentation here: scRNA seq Analysis engine The Automated Target ID will provide a mechanistic pathway analysis. Here the engine constructs gene regulatory networks to reveal how the drug-target interaction affects cellular behavior through regulatory cascades. In additional phenotype predictions will be provided, and should align with your therapeutic goals. To further understand how to interpret the outputted graphs, you can refer to the engine specific documentation here: scRNA seq Analysis engine The Temporal Omics Engine provides response kinetics modeling. Here the engine will analyze the temporal dynamics to understand how fast and in what sequence cellular response occurs. Pseudotime heatmaps order gene expression changes by progression, and ODE based simulations predict temporal dynamics of key genes.To further understand how to interpret the outputted graphs, you can refer to the engine specific documentation here: scRNA seq Analysis engine Results
  • List of candidate cell lines and their associated nTPM scores
  • A panel of scRNA seq datasets corresponding to the candidate cell lines
  • DEG Analysis plots (Volcano Plots, Clustering Visualizations, Differential expression gene lists)
  • Automated Target ID plots (GRN Graphs, Cascade trees, phenotype bar graphs)
  • Temporal Omics (Pseudotime heatmaps, Trajectory plots, ODE simulation results)
When interpreting, you will keep these key metrics in mind. These 4 metrics will hold the highest weight: nTPM scores, DEG count and fold change magnitude, cascade tree depth and breadth, and phenotype score alignment. High nTPM scores indicate more drug-target engagement, more significant DEGS indicate a stronger response, deeper and broader cascades indicate extensive effects, and phenotype predictions match therapeutic goals. With the cascade trees you can evaluate whether key genes are being affected downstream of your target gene. In addition you can use Revilco Agent to assist you in evaluating and ordering the cell lines based on these metrics
  • Why Revilico?
    The goal of this workflow is to systematically identify the cell line that will show the best therapeutic response for a drug-target complex based on its molecular profile before moving into costly experimental tests. This is achieved by first identifying candidates based on target expression (nTPM scores) and then running a comprehensive multi-modal scRNA-seq analysis (DGE, Automated Target ID, Temporal Omics) to characterize the molecular mechanisms driving drug efficacy.